shawonsowdagor
Bangladesh

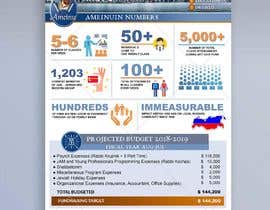
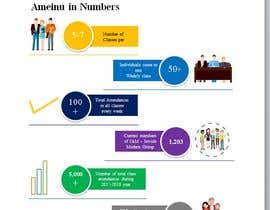
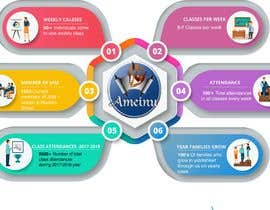
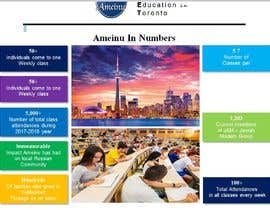
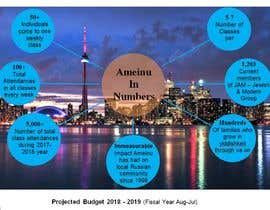
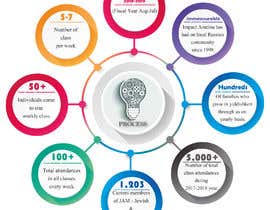
I have a bunch of numbers - statistics that describe what my organization does. I would like someone to turn that into an infograph for me. Ideally to be editable in MS Word. Essentially it should be the top half of the second page of the attached document. The bottom half should remain the same. Budget $20-30. Use images like people (ideally not gender specific), skyline of Toronto, Logo of my orginization...Leave room for the budget on the bottom (or side).
“Destiny entered a contest and I liked her design over all the others. She then listened to my feedback and was patient. We went back and forth around 5 times and each time she followed the instructions and came up with a very pleasing product. ”
![]() eymandel, Canada.
eymandel, Canada.