Data points to video

  • 状态: Closed
  • 奖金: $100
  • 参赛作品已收到: 4
  • 获胜者: ZhanBay

竞赛简介

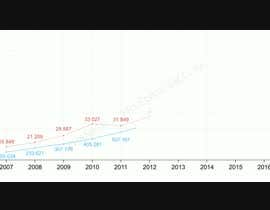
I want to show 11 years worth of data (two data points) over time in a video. Ideally it would be two lines moving over time that would be dispersed throughout the video. If that's not possible just to show the two data points going up over the years 2007 through 2018.

Year Total Number Served Lbs of Food distributed
2007 16849 150034
2008 21209 233627
2009 25587 307176
2010 33027 405281
2011 31849 537167
2012 38749 685246
2013 37096 863390
2014 37470 1084442
2015 80260 1336798
2016 76345 1770829
2017 92276 2120798
2018 77460 1809000

您还可能感兴趣的技能

雇主反馈

“Very skilled but needs to work on English proficiency.”

个人主页照片 missioned, United States.

此竞赛的顶尖作品

查看更多参赛作品

公共说明面板

  • lujaguru
    lujaguru
    • 5 年 之前

    Could you please have a look at my entry #13 . There's youtube link to new version of the entry comment.

    • 5 年 之前
  • ZhanBay
    ZhanBay
    • 5 年 之前

    Please check #3 .
    Link to the new version of the animation ...

    • 5 年 之前
  • lujaguru
    lujaguru
    • 5 年 之前

    I've made some changes to the entry #13. Check the link in the comment in my entry.

    • 5 年 之前
  • thanghm
    thanghm
    • 5 年 之前

    Do you want just lines in the chart or other expressions like bars?

    • 5 年 之前
  • samimkeremsayin
    samimkeremsayin
    • 5 年 之前

    ı working please wait :)

    • 5 年 之前
  • ailingtay
    ailingtay
    • 5 年 之前

    hey there, how long should the video run for?

    • 5 年 之前

显示更多评论

如何以竞赛开始

  • 发布您的竞赛

    发起您的竞赛 快速简单

  • 获取众多参赛作品

    获取大量参赛作品 来自世界各地

  • 悬赏最佳参赛作品

    悬赏最佳参赛作品 下载文件-简单!

立即发布竞赛 或者立即加入我们!