Infographic of business models

  • 状态: Closed
  • 奖金: $50
  • 参赛作品已收到: 9
  • 获胜者: merabishviliami5

竞赛简介

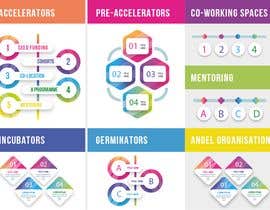
We wrote a rather dry report for the government about accelerators, incubators, etc. and want to create a more engaging infographic to visualise 7-10 business models and their KPIs.
• Accelerators: p. 23-27, incl accelerators with incubation and university-based accelerators.
• The latter are actually more like pre-accelerators (p. 31-33)
• Co-working spaces: p. 30-31
• Incubators: p. 33-36
• Germinators (aka Labs): p. 36-37
• Mentoring: p. 37
• Angel organisations: p. 38

您还可能感兴趣的技能

雇主反馈

“Miriam was quick to provide a proposed solution that showed she read the brief. She then followed up with good questions and an updated solution that actively showed she had taken the time to understand the task at hand. I'm now working on generating more detailed design briefs I can send directly to her.”

个人主页照片 mbliemel, Australia.

此竞赛的顶尖作品

查看更多参赛作品

公共说明面板

  • mbliemel
    竞赛主办者
    • 4 年 之前

    Thinking out loud here .. Might be easiest if there's ONE graphic for EACH of the seven main business models that visually shows which (partial) elements they have and describes their metrics. There could be a separate legend to explain the weighting of each factor, drawing on the second table in the "accelerator business models.docx" I just uploaded. Not sure if you can see each others' submissions, but #3 is a strong step towards all 7 models as separate graphics, but could have more visual consistency across all 7, and would ideally include a description of metrics for each model as per the third table in the "accelerator business models.docx" file.

    • 4 年 之前
  • mbliemel
    竞赛主办者
    • 4 年 之前

    Hi everyone, I just uploaded another doc that pulls out the lorem ipsum for each of the 7 main business model's performance metrics and an explanation of the weighting of each of the 5 elements. That way you don't need to dig through the full report this is based on. I'm totally open to better icons for each of the 5 elements than the ones I included.

    • 4 年 之前
  • fardiaafrin
    fardiaafrin
    • 4 年 之前

    Working... on your project. I will Show you my design Before the end of this contest. Please don't chose the winner early. Thanks.

    • 4 年 之前
    1. mbliemel
      竞赛主办者
      • 4 年 之前

      a few more just came in and i rated & commented on the 3-4 that caught my interest so far. i set myself a calendar reminder to check submissions closer to when the competition closes, so will leave it open to the end.

      • 4 年 之前
  • mbliemel
    竞赛主办者
    • 4 年 之前

    Thanks for the comment Sabiq. I just added the xlsx file from which I created the spiderplots: "Accelerator data (26Aug16 - only spider plots).xlsx" The first tab as the 7 main business models for which I'd like better visualisations than the spider plots. Each visual should be accompanied by the list of key metrics and secondary metrics (final metrics are in the report and draft versions are in the xlsx).

    • 4 年 之前
  • mbliemel
    竞赛主办者
    • 4 年 之前

    FYI The baseline business model for an archetypical accelerator has all 5 elements. All of the 7-10 business models are effectively different combinations of the same 5 elements (e.g. 2 present, 1 partially present, 2 absent). So it would help if the infographics were modularised so that viewers see the full model for accelerators, and then the partial models that represent the other business models.

    • 4 年 之前
    1. Ghidafian
      Ghidafian
      • 4 年 之前

      Hi,
      Do you have a raw file (pivot) of that infographic, such as excel or else?
      Maybe, it will really help us, especially to determine the accuracy of the infographic table area that will be created.

      • 4 年 之前

显示更多评论

如何以竞赛开始

  • 发布您的竞赛

    发起您的竞赛 快速简单

  • 获取众多参赛作品

    获取大量参赛作品 来自世界各地

  • 悬赏最佳参赛作品

    悬赏最佳参赛作品 下载文件-简单!

立即发布竞赛 或者立即加入我们!