DesignerAasi
Pakistan

Hello.
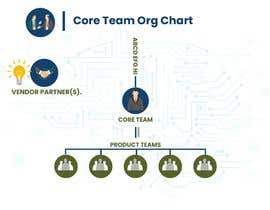
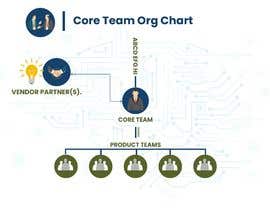
I need to show a power point info graphic that shows a data analytics machine learning theme that has:
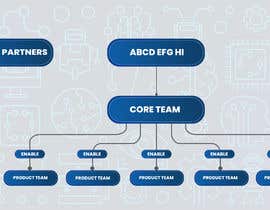
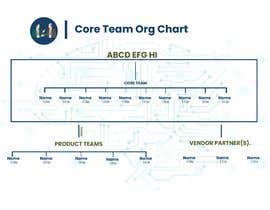
1. Core Team Org Chart (that has 10 roles in a hierarchy format reporting upwards to two managers with a box above them all called "Core Team").
2. Core Team Org Chart (#1 above) connects multiple product team boxes (Called Product Teams ) under it (boxes should be up to 5 different product teams ) . Connector should have the word 'enable' on it: with
2. Need another box on the side of the org chart (#1 above) that says "Vendor Partner(s). Should also indicate "Learn fast and accelerate and apprentice to master learning human learning)
3. Need another box that is an input to the #1 Team Org Chart above that has ABCD EFG HI (this should be an input to box #1)
Need it to really have a machine learning team
RGB Colors we would like to use are:
Dark BLUE: 14, 64, 106
Dark GREEN: 85, 98, 43
Charcoal: 85, 87 89
Looking for an info graphic that is super fun, creative and dont forget the machine learning theme.
“Thanks for your patience and your clear clarification questions and mockups”
![]() samiadg, Canada.
samiadg, Canada.