
受到知名品牌和初创公司的信任



Visualization is the art of transforming complex data and concepts into visual formats like charts, graphs, and infographics. It helps businesses turn raw numbers into meaningful insights that are easy to understand and act upon. Visualization Experts specialize in data visualization, information design, and creating visual narratives that effectively communicate your data's story.

Looking to bring your data to life? The best way to find a quality Visualization Expert is on Freelancer. With Visualization Experts for every budget, Freelancer is the easiest way to connect with professionals who can turn your data into compelling visuals.
免费发布您的项目,对接娴熟的Visualization Experts,他们今天就能开工。查看竞标方案、评分和作品集,满意后再付款。
~20秒
即可收到首个竞标
75+
个竞标/项目
25+
Visualization Experts在线
无需预付 · 满意后付款


8.6
8.6
100%

Radaur, India
$20 USD 每小时



9.4
9.4
98%

Karachi, Pakistan
$20 USD 每小时

8.7
8.7
100%

Sooriyawewa, Sri Lanka
$15 USD 每小时

8.3
8.3
100%
karachi, Pakistan
$50 USD 每小时

9.0
9.0
100%
New Delhi, India
$50 USD 每小时

7.3
7.3
100%
YAMUNANAGAR, India
$12 USD 每小时

8.3
8.3
99%
Karnal, India
$20 USD 每小时

8.9
8.9
98%
Kasur, Pakistan
$35 USD 每小时

8.3
8.3
99%
Karachi, Pakistan
$25 USD 每小时
想雇佣一位 Visualization Expert 吗?这些是近期Freelancer上完成的高评分Visualization项目,均选自客户评分4.5星及以上的真实评价,名单每月更新。
项目
A Pine Script trend indicator was built in TradingView, plotting color-coded signals driven purely by price data with adjustable smoothing and look-back inputs. The client confirmed it exceeded expectations, with on-time and on-budget delivery across the freelancer's 15 completed projects.
客户评价
Perfect work and delivered more then expected
Financial Markets · Market Research · Financial Analysis
项目
Architectural DWG drawings were converted into a Revit BIM model at LOD 300, with layered walls, parametric families, and full room schedules for plans, sections, and quantity takeoffs. The deliverables included a native .rvt file, IFC export, and PDF views.
客户评价
Great job, He did exactly what I needed. I recommend him ?.
CAD/CAM · 3D Rendering · AutoCAD
项目
A 10-slide executive PowerPoint was built for a senior leadership review, translating store performance data, KPI dashboards, and a career timeline into McKinsey-style corporate visuals. The client called it the best quality presentation they had seen.
客户评价
Absolutely amazing, very patient, the best quality presentation I have seen
Graphic Design · Business Plans · Corporate Identity
A visualization expert transforms raw data, concepts, or designs into clear visual assets such as charts, dashboards, 3D renders, infographics, and interactive graphics that help audiences understand complex information at a glance. Hiring a skilled visualization expert turns dense spreadsheets, architectural plans, scientific datasets, or business intelligence outputs into compelling visuals that drive faster decisions and stronger engagement.
Visualization specialists sit at the intersection of data analysis, design, and storytelling. They translate numerical, spatial, or conceptual information into visual formats that are accurate, accessible, and persuasive. Depending on the project, a data visualization expert may build executive dashboards, a 3D visualization expert may produce photorealistic product renders, and a scientific visualization expert may animate molecular structures or geospatial datasets.
The commercial value is direct. Clear visuals shorten the path from data to decision, win pitches, support marketing campaigns, and make technical material understandable to non-specialist stakeholders. Whether the goal is a board-ready dashboard or an architectural walkthrough, the visualization specialist controls how the audience perceives the information.
Scope varies by sub-discipline, but most visualization projects involve one or more of the following outputs:
Strong visualization experts are fluent in the tools that match their domain. For data visualization, that typically means Tableau, Power BI, D3.js, Python, R, and SQL for data preparation. For 3D and architectural work, expect proficiency in Blender, 3ds Max, V-Ray, Corona Renderer, Lumion, Unreal Engine, and Adobe Substance for materials and texturing. Motion and infographic work usually leans on Adobe Creative Cloud, particularly Illustrator, After Effects, and Photoshop.
On the methodology side, experienced specialists apply principles from information design, cognitive load theory, and color theory. They follow accessibility standards, choose chart types based on the data relationship being shown, and design with the end audience and viewing context in mind.
Visualization work spans almost every sector. Common engagements include:
The best signal is a portfolio that matches your sub-discipline. A data visualization specialist should show interactive dashboards, well-labeled charts, and case studies explaining the data problem solved. A 3D artist should show high-resolution renders, lighting variation, and material detail. Look for consistency across projects, not just one polished hero piece.
Beyond the portfolio, weigh tool proficiency against your tech stack, domain familiarity (financial data, architectural plans, or scientific datasets each have their own conventions), and the candidate's ability to articulate design decisions. Strong visualization experts can explain why they chose a particular chart type, color palette, or render setting.
Useful interview questions to ask shortlisted candidates:
Freelancer.com gives you access to a global pool of visualization specialists covering every sub-discipline — from BI dashboards to architectural rendering to scientific illustration. You can compare portfolios, ratings, and verified reviews side by side, and post a project on Freelancer.com to receive competitive bids from freelancers whose skills genuinely match your brief. Clients set their own budgets, and Milestone Payments protect funds until each deliverable is approved, making it straightforward to hire on Freelancer.com with confidence at any project size.
Hiring the right visualization expert starts with a clear brief, continues with careful review of proposals, and ends with a confident award decision based on portfolio evidence. The process below is built around the realities of visualization work — where output formats, tool stacks, and domain context vary dramatically from project to project.
Your project post is the single biggest determinant of bid quality. A precise brief filters out generalists and attracts specialists whose tools and portfolio actually match your deliverable. Head to the
Bids are short proposals, not just price quotes. They reveal how each freelancer interprets your brief, what approach they propose, and whether their suggested timeline is realistic for the work involved. Read carefully and shortlist candidates whose understanding of the visualization problem matches what you actually need.
Your final decision should combine proposal quality with profile evidence. Portfolio depth, ratings, written reviews, and verified credentials all matter — and consistency across past projects is more telling than a single standout piece. For visualization work, look closely at whether prior outputs match your domain and required level of polish.
A data visualization expert turns numerical and categorical data into charts, dashboards, and infographics using tools like Tableau, Power BI, and D3.js. A 3D visualization expert builds three-dimensional renders, animations, and interactive scenes in tools like Blender, 3ds Max, or Unreal Engine. They are distinct disciplines, so match the freelancer to your specific output.
A single dashboard or set of static charts can be completed in days, while a complex interactive dashboard, architectural walkthrough, or animated 3D scene may take several weeks. Timelines depend on data readiness, asset availability, revision rounds, and render complexity. Confirm scope and milestones in writing before kickoff.
Yes. Most clients on Freelancer.com hire visualization experts for fixed-scope deliverables such as a pitch deck, a property render, or a single dashboard. You can also engage the same freelancer on an ongoing basis for recurring reporting or a series of renders.
For data visualization, you typically supply the raw dataset or database access, though many freelancers can also help with cleaning and modeling. For 3D work, you may provide CAD files, floor plans, or product specs, but visualization experts can also build assets from scratch when source files are not available.
For a defined project with clear deliverables, an independent freelancer is usually faster and more cost-efficient. Agencies make sense for very large, multi-discipline programs requiring teams across data engineering, design, and development. Many businesses successfully scale visualization work through long-term relationships with freelancers on Freelancer.com.






今天发布一个项目,从有才华的威客们那里获得竞标
从Visualization项目中获得一些灵感
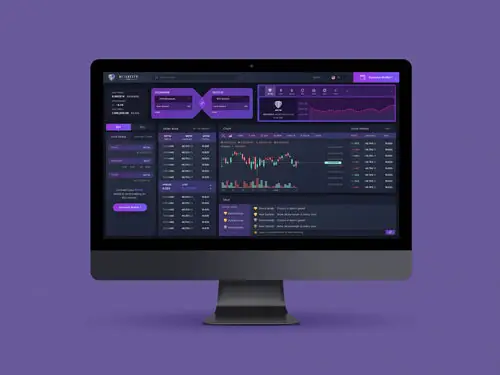
网站设计。
7天内540美元。
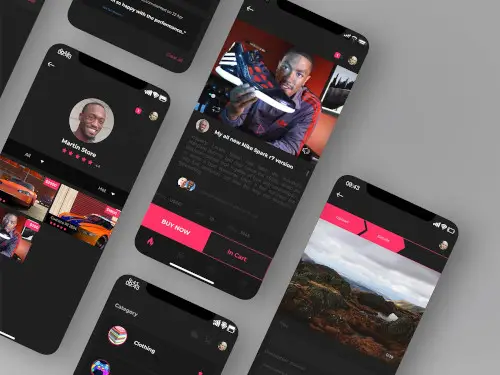
App设计。
1天内$100美元。
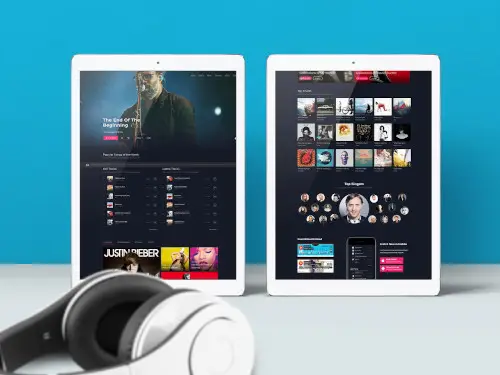
网站。
1天内430美元。

网站设计。
13天内140美元。

App设计。
19天内200美元。

网站。
13天内150美元。

网站。
1天内240美元。
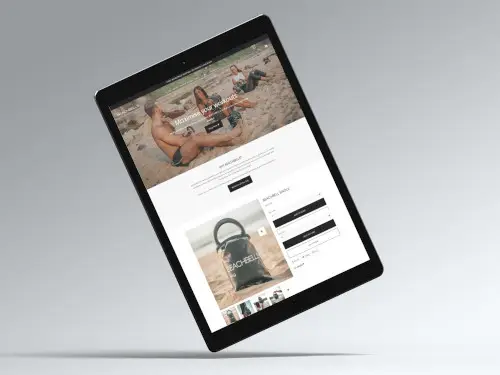
网站。
1天内$100美元。


数百万名用户,从小型公司到大型企业,从企业家到初创公司,都在用Freelancer将他们的想法变成现实。
90.7百万
90.7百万
注册用户
25.9百万
25.9百万
发布工作总数
威客
关于
条款
合伙人
应用程序